2 Which Causal Inference?
2.1 My Story
I graduated in 1999 from the University of Tennessee at Knoxville with an English major and the serious goal of becoming a professional poet. But, while I had been successful writing poetry in college, I quickly realized that the road to success beyond that point was probably not a realistic one to take. I was newly married with a baby on the way and working as a qualitative research analyst doing market research, and slowly I stopped writing poetry altogether.1
My job as a qualitative research analyst was wonderful and eye opening in part because it was my first exposure to doing anything seriously empirical. My job required me to do “grounded theory”—a kind of inductive approach to generating explanations of human behavior based on observations I made running focus groups and conducting in-depth interviews, as well as using other ethnographic methods. I approached each project as an opportunity to understand why people did the things they did (even if what they did was buy detergent or pick a cable provider). And while the job inspired me to develop my own theories about human behavior, it didn’t provide me a way of falsifying those theories and I was limited in what I could study.
A lot of people get to economics because of a math background or a deep interest in public policy, but for me, it was always a desire to understand behavior on topics I found interesting. That desire to understand behavior is probably how I found economics, even though finding it seems as much then as now to have been purely by chance.
I lacked a background in the social sciences, so to make up for lost time, I would spend my evenings reading articles I had earlier printed out at work. I don’t remember how I ended up there, but one night I was on the University of Chicago Law and Economics working paper series when a speech by Gary Becker caught my eye. It was his Nobel Prize acceptance speech on how economics applied to all of human behavior (Becker 1993), and reading it changed my life. I thought economics was about stock markets and banks until I read that speech. I didn’t know economics was a prism that one could use to study all of human behavior. That discovery was overwhelmingly exciting, and a seed had been planted inside me.
But it wasn’t until I read Lott and Mustard (1997) that I became truly enamored with economics. I had no idea that there was an empirical component where economists sought to estimate causal effects with quantitative data. One of the authors in Lott and Mustard (1997) was David Mustard, an associate professor of economics at the University of Georgia and one of Becker’s former students. I decided that I wanted to study with Mustard and therefore applied for University of Georgia’s doctoral program in economics. I moved to Athens, Georgia, with my then wife, Paige, and our infant son, Miles, and started classes in the fall of 2002.
After passing my first year comprehensive exams, I took Mustard’s labor economics field class and learned about a variety of topics that would shape my interests for years. These topics included the returns to education, inequality, racial discrimination, crime, and many other fascinating topics in labor. We read many, many empirical papers in that class, and afterwards I knew that I would need a strong background in econometrics to do the kind of research I cared about. And since econometrics was the most important skill for that research, I decided to make it my main field of study. This led to me working with Christopher Cornwell, an econometrician and labor economist at Georgia. I learned a lot from Chris, both about econometrics and about research itself. He became a mentor, coauthor, and close friend.
I still remember a professor saying to me once, “Scott, we think you’ve got a lot of potential, but you’re definitely the least qualified of your cohort.” I still do not know if that was meant as a compliment, but I took it to mean that I could not reach my potential if I didn’t do everything I could to patch that hole. And that meant specializing in econometrics. So I took all the econometrics courses offered at the University of Georgia, and some more than once. They included classes with names like probability and statistics, cross-sections, panel data, time series, and qualitative dependent variables. I found econometrics to be profoundly difficult and very abstract. I won’t even pretend I was good at it. And while I passed my field exam in econometrics, even up until the end of my time as a PhD student, I struggled to understand the point exactly. It is possible, as the saying goes, that I just could not see the forest for the trees. Something just wasn’t clicking. But more than likely, that was a good thing as being confused for long stretches of time appears to be one of the main ways we learn and grow.
It was while writing the third chapter of my dissertation that I noticed something I hadn’t noticed before and it was in retrospect a surprisingly small detail. In the Indigo Girls song “Ghost,” they said that there’s a place in Minnesota where you can cross the Mississippi River in only five steps even though further down the United States it is a dangerous river with a crushing current. In a similar way, causal inference started out for me like that and ended like that too. When I read a book on sex and abortion by Levine (2004), I saw a table that would have a jarring effect on me. Levine, who I later learned studied at Princeton in the 1980s and had been in an academic unit of the school called the Industrial Relations Section, was reviewing all the papers that had been written about abortion and public policy. But because most of the papers used a method called difference-in-differences, and because his book was written to a general audience, he made a “cheat sheet” to explain what difference-in-differences was and did. The table was very simple—far more so than any of the econometrics I’d learned in school. But for some reason it opened things up for me, and I still remember tracing my finger across each row of that table, crossing things out as I did, until I ended with a particular letter that had been previously trapped amidst other letters. I remember doing that, looking up and thinking to myself, “Has this been what it’s always been about?”
I now know that my econometrics training had been fairly traditional. It had not covered the material in this book. I don’t mean we didn’t study instrumental variables or panel methods, because we did. But there was still something different about the way I learned it then and how I think of it now. I am not sure, to be honest, if I had ever even heard the word “causal” when I was a graduate student at the University of Georgia from 2002 to 2007. I was notoriously bad about skipping class and spending all day studying in the coffeeshops instead, so it’s possible it was on those days that my professors talked about causal inference. But regardless, it was Levine’s diff-in-diff table, just like Becker’s Nobel Prize speech, that punctured a hole inside me, like a log bursting through a dam. I became genuinely obsessed with getting to the bottom of it, and this book is where that obsession led me.
Around 2013, shortly after getting tenure, I asked Baylor if I could prepare a course called “Applied Econometrics.” I applied for a grant to attend two workshops at Northwestern University on “causal inference” (a phrase I had still never heard), and there I heard Alberto Abadie, Don Rubin, and several luminaries teach. I came home mesmerized and began building my course. I studied everything I could find online, read everything I could get my hands on—anything I thought that could help me, I would read it and use it. The lecture slides grew and grew, over several years, until I had over a thousand slides.
Then, starting in 2017, dissatisfied with the textbook options for my students, I decided to write up my lecture slides into this book. As writing books is not very common or even necessarily rewarded in economics, compared to writing articles in highly ranked academic journals, I decided to post my book for free online when it was finished. My friends and family thought that was crazy, but I could not see the point of publishing a book that would be sold at extremely high academic prices, or that would sit on the shelf of some library not being read.
But, since I wanted the book to be free, I also felt the freedom to explain the material playfully, to be myself and simply enjoy the process. I also decided to make the book very hands-on and empirical, with a lot more code and exposition than most of the books that I had read. Early on, I stored tons of datasets on my academic website and had code embedded that a reader could just copy to run the analysis. I filled it with metaphors and stories and references to rap music. Since I figured it didn’t really matter and that very few would read it anyway except my students, why not have fun with it and do the kind of creative writing I had always done as a kid? But Yale University Press took notice and offered to publish the book, and I said yes.
This book has a particular audience in mind. It is a young woman studying economics in New Delhi. It is a young man studying education at Middle Tennessee State University. It is a junior faculty in Italy, a seasoned professional in industry. I can see these people in my mind when I close my eyes. They remind me of me and I want to talk with them, listen to whatever they’re struggling with, and try to find a different way of saying things that they will understand. I wrote this book for people who sit in the back of the classroom because I have always sat in the back of the classroom.
I talk a lot in the book around where I understand these ideas to have come from. Some people will benefit from this narrative approach, and some won’t. Some don’t need to learn stories about Orley Ashenfelter and David Card to understand difference-in-differences or instrumental variables, and so will probably skip over those parts. But for someone, I bet hearing the convoluted way in which causal inference emerged in economics could very well be like a skeleton key that unlocks the entire book.
You write for the audience you have in mind, and the people I have in mind are diverse but have one thing in common—they want to understand the types of causal inference methodologies in this book, and they have obstacles that they want help overcoming.
So, let me tell you a little more about the big picture that I was always lacking before we move into the more technical material that defines the rest of the book’s table of contents.
2.2 Causal Inference Is the Mississippi River
I’ve spent almost half my life around the Mississippi River, which is a major river that runs south through the United States. I grew up in Mississippi, the state the river is named after, and in the 8th grade, moved to Memphis, Tennessee which sits right next to the river as well. And then, right after college and before grad school, my ex-wife and I lived in New Orleans, Louisiana which is called the Crescent City because the Mississippi River meanders into the shape of a crescent around it. The river is a special place to me and my family and really everyone from the Southern United States. It’s an exciting, historic, mighty, and dangerous river. Jeff Buckley, the singer, one night in Memphis unwisely decided to swim out into it not realizing how dangerous it is. The undertow grabbed hold of him and he vanished. I once saw a giant log floating on the Mississippi get sucked down by the undertow and never come back up.
Causal inference is, to me, like the Mississippi River. I say that because, like the river, causal inference is a single river fed by many tributaries. And each of those tributaries has contributed something different to the main river they feed into—and not all of those tributaries are easy to reconcile with one another, or play well together, which contributes to its animation, eccentricities, and energy. The very thing that makes it an exciting and interesting field is what makes it feel like you walked in a third of the way into a science fiction movie. You want to ask the people beside you who that alien is or some other critical detail that you must have missed, but you can’t—otherwise you might be shushed. It can be intense, territorial, filled with very strong personalities and strange-sounding statements that border on the supernatural.
My book is not a book about causal inference so much as it is a mixtape about causal inference, and that’s an important distinction because mixtapes are not meant to include every song. Mixtapes are personally curated albums of other people’s songs, put together in a genuine, though clearly unprofessional, style. When I was a kid, my mixtapes had doodles and big stenciled letters as cover art. And I did it for really only three reasons. First, I have always made my friends mixtapes because I love making mixtapes. I did then, and I still do now. Second, I make mixtapes because I love giving people mixtapes. And third, I make mixtapes and give people mixtapes because I want to connect with them and in my mind, giving people mixtapes is one of the ways I do that. That friendship logic has always made sense to me, but writing it down like that, it does sound a little strange. Nevertheless, this is my latest mixtape, and this table of contents, each filled with exposition, are other people’s awesome songs.
But one peculiar thing, maybe even offputting, is that my mixtape is about two academic institutions that became major contributors to what we now associate with causal inference. They are like two tributaries that existed before they mingled and mixed, but now that they have, they somehow seem like they always belonged together—but in reality, they really seemed to come from different energies, different people, different reasons for existing. That is my way of saying that this is decidedly not a mixtape about all of causal inference as that would be too daunting and possibly even impossible. And, just as you shouldn’t assume that the rivers that feed into the Mississippi are the Mississippi, as there are more things in that river than just the selected tributaries you chose, you should not assume that the things I discuss here are synonyms for causal inference either, as there is a third tributary that I don’t cover which I simply call “Much More Stuff.”
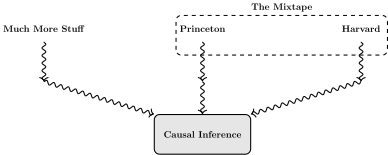
So, which two rivers is this book about? The first river is the Princeton Industrial Relations Section, under the influence of Orley Ashenfelter, one of the very first quantitative labor economists and a highly impactful scholar and visionary. The second is Harvard University’s statistics department and primarily Don Rubin, as well as later its economics department through Joshua Angrist, who had come from Princeton under Orley and David Card, and a young econometrician from Brown named Guido Imbens. Oddly enough, nearly all of the estimators and research designs in this book can be traced back to one of those two rivers.
And the importance, I think, of emphasizing these two distinct academic units is that they were originally more different than similar, which I think is what ultimately made their final mold so unusual and original. For instance, Princeton was home to empirical labor economists who were basically obsessed with exiting a vast empirical crisis in the 1970s that haunted the field and moving towards, therefore, more credible descriptions of policies aimed at workers. And this led them to change their approach by de-emphasizing modeling and emphasizing instead the mimicry of the experimental design, even when the experiments were run by nature, and not humans.
But Harvard was not like that. It was not a scientific movement led by labor economists trying to resolve their own credibility crisis. It was led by theoretical statisticians and econometricians building out an approach to causal inference that was mathematically and statistically correct, based on early 20th century scientific paradigms about randomized experiments—an approach that could be practically useful for all scientists, not just those running randomized controlled experiments. The exception would probably be Josh Angrist, a young labor economist and now the corecipient of the Nobel Prize in Economics (along with David Card, his former advisor from Princeton, and Guido Imbens, his Harvard colleague). Angrist straddled those two worlds—that of the dogged empiricist on a quest for authentic and reliable scientific statements about the real world, and that of someone who pushed himself to deepen our understanding of core methodologies from econometrics, namely the instrumental variables technique.
These two academic units did not naturally belong together. They were born out of very different scientific traditions, led by very different people, who had no reason to know one another let alone work together. One of them was a technical statistical framework that was being prolifically spread outside of the randomized experiment, and the other was a group of scholars with the need to obtain the most believable and reasonable descriptions of programs aimed at workers, using shoe leather, ingenuity, and rigorous common sense. They started out completely separate from one another, intellectually and socially, but over time became intertwined, and when they did, they deposited into the Mississippi, each bearing the marks of the other.
2.3 Two Rivers into Causal Inference
You will notice as you read the book that I lean hard into the following diagram to help guide readers through the material. This diagram is my way of trying to lay out for you the sociology, the history, and the biography—or what I sometimes just call “the story"—that created and supported the design approach to causal inference. The design approach is the particular kind of applied work that was created to have a firmer, more credible, foundation for empirical causal inference. On the one hand, it is rooted in the experimental design tradition going back to the early 1920s. But on the other hand, it is rooted in an academic unit at Princeton devoted to studying”manpower” and industrial relations. There were links along the way, and I try to share those links in the hopes that at least some of you might find it helpful, but I try my best to do so with a soft touch.
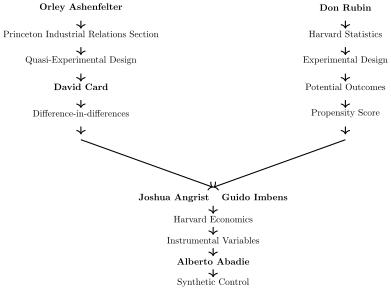
The history of the experimental design is the history of two things. First is the creation of mathematical notation called potential outcomes by a master’s student in 1923 named Jerzy Neyman. Second is the deepening of our understanding of the properties of randomization when applied physically with manipulated interventions in the real world. It’s both of these things—both a theoretical framework for defining causality and an understanding of the role that mechanisms play when they put some units into one group but not others. That is the heart of the experimental design tradition, and that is one part of this story.
But the other part of this story is the quasi-experimental design tradition. While it would be an extreme overstatement to say that Princeton’s Industrial Relations Section, under people like Ashenfelter, David Card, Alan Krueger, Janet Currie, Bob LaLonde, and others, invented the natural experiment, it would also be false and bad faith to pretend that this group was, good or bad, anything other than highly influential and impactful in making it as popular as it has become. How and why precisely they were so successful at applying this quasi-experimental design approach is the topic for a different book. I include the stories in this book primarily so that readers who are not from economics can see that these empirical labor economists, focused on things like job training programs, were most likely not setting out to start a revolution. They were most likely just setting out to do the best work they could do. But, in so doing, they ultimately gave a particular shape, like the Mississippi River does to the Crescent City, to what causal inference became. And I suspect that it may feel a bit odd for you sometimes if you are not yourself a labor economist, or maybe even an economist at all. But at least learning the background and origin story will, I hope, illuminate the path for you just like it has for me.
2.4 Princeton Industrial Relations Section Responds to the Empirical Crisis in Labor Economics
The thing to keep in mind as you read this book is that what seemed to propel Princeton Industrial Relations Section towards causal inference was not a direct interest in that topic. It was rather a mixture of several other things. First, it was in response to what was widely known to be an entrenched empirical crisis in labor economics, and if I’m not mistaken, macroeconomics as well. Labor and macroeconomics are, in many ways, close cousins of each other within economics. They were the two fields that for a very long time were fused together and did not really start to separate until the middle of the 20th century. Both fields have been, in many ways, the fields that are preoccupied with overall well-being, standards of living, and the welfare of people—only one focuses on aggregations of those things and the other on the individual experiences of workers inside markets.
In the 1970s, the empirical work was thought to be irreparably flawed. That statement had been said to me repeatedly through interviews for my podcast, The Mixtape with Scott—so many times that I am no longer surprised when I hear it. What made this empirical crisis different from today’s was that the empirical crisis in the 1970s really was not caused by malfeasance or coding errors. It seemed more to do metaphorically with how a child that is first learning to walk will often fall and hit their head. That is, it had to do with how early social scientists used large datasets and computers for analysis.
Large IBM mainframes had begun appearing across universities in the 1960s and 1970s. Large federal surveys about workers were appearing and making obsolete old aggregate data sources. Advancements in econometrics were ongoing. One could perhaps even say that economic problems and the growth in the United States’ own government, with its many policies and programs aimed at the poor and disenfranchised, were under scrutiny. For reasons that I can only speculate on, it seemed as though the awareness and concern about empirically unreliable studies was growing. Not so much that the problems were growing, I mean that the awareness that these things even existed. The 1970s appeared to be a time when, at least in labor and industrial relations, researchers were growing increasingly focused on empirical work being reliable and correct, or what Princeton would say “credible.”
The job training program in particular functioned almost like a totem for advances in causal inference at Princeton’s Industrial Relations Section. It was after all the problems of getting reliable estimates of the job training program that prompted Orley Ashenfelter in 1974 to call for the creation of randomized experiments (Ashenfelter 1974, 1997). It was the job training programs—intimately connected with the availability of new data sources—that were so interesting that Orley, when he graduated from Princeton, chose to go to Washington DC to work with these data, and on this application, himself. And, it was the job training programs that in many ways were largely responsible for the rediscovery of difference-in-differences by Orley, and then again later by David Card (Ashenfelter and Card 1985).
Somewhere in all of that, the Section grew several different branches, one of which was the world’s greatest labor economics department at the time. It was a place where serious labor economics was conducted, arguably superior even to MIT and Harvard. The professors at Princeton were deep people about all aspects of labor economics, very original and creative, very scholarly, very practical and rigorous. Their knowledge of microeconometrics, their utility at working with raw data, their demands, their constant pushing the frontier was truly spectacular. Several go on to win Nobel Prizes, and perhaps that wave is not yet done. And it was also where, almost completely detached from labor economics itself, a myopic focus on the randomized experiment and design principles took hold of the imagination of its faculty and students.
2.5 Harvard University Builds on the Experimental Design
Don Rubin spent most of his career at Harvard University in the statistics department. He was prolific and highly impactful and virtually singlehandedly expanded on the early 1920s material by Jerzy Neyman and Ronald Fisher to build out the theoretical material we now call simply “potential outcomes.” This material had absolutely nothing to do with labor economics. It was much more connected to the historic experiments in agriculture and medicine than it was economics. In fact, economics, as a science, only briefly flirted with potential outcomes before going in an entirely different direction (Angrist, Graddy, and Imbens 2000; Imbens 2020). And it would be a long time before those frameworks would return into economics, and when they did it was largely through J. J. Heckman and Robb (1985) and Imbens and Angrist (1994), both of which were theoretical econometrics studies connected to Princeton Industrial Relations Section, ironically.
His advances were extremely practical and useful, though. They were simultaneously theoretical and valuable to researchers, just like Fisher’s own work had been. Some of his most cited work, for instance, was on the naturally occurring variation in the real world where causal effects might be estimated by reassembling the broad shape of the randomized experiment through the careful use of covariates. His work on the propensity score, for instance, with his student Paul Rosenbaum is one of the most cited papers in the history of statistics and with each year only grows in influence (Rosenbaum and Rubin 1983). And his impact would continue through collaborations with a labor economist from Princeton and a young econometrician, both in the economics department at Harvard.
Joshua Angrist graduated from Princeton in 1989 with a dissertation that had used instrumental variables (IV) to study the effect of military service on career earnings (Angrist 1990). One of the things that made Angrist’s dissertation unique wasn’t so much that he used IV, but that he used a credible instrument at a time when few researchers did. In fact, at the time, a common practice would be to use instrumental variables and not even tell people what the instrument was. Angrist couldn’t have been more different. Not only did he tell people what his instrument was, but it was what the instrument actually was that was a bit startling and unusual for its day. Angrist (1990), in a study estimating the causal effect of military service on career earnings, instrumented for military service with the United States draft lottery.
The draft lottery was both well known and kind of crazy when you think about it. It was crazy because the United States government had been openly running a randomized experiment for years to partially pick its soldiers. The instrument was coin flips. Heads and you go to Vietnam and fight in combat and tails you stay and live your life however you want (Angrist 1990). But unlike polio vaccines or COVID vaccines, this randomized experiment was being done outside of the crystal clean conditions of the scientific lab. There were no biologists or chemists standing over the men, flipping their coins, and shifting one into the military or not, ensuring the experiment be done perfectly, and yet on some level, the government was. I mean, they were—we know that they were.
It was not common at that time to use coin flips as instruments. It wasn’t common for the instruments to be vigorously defended as exogenous. If I had to offer a guess as to why practices had been as they had been, it was there was a collective latent belief that statistical models identified causal effects. The concept of the “treatment assignment mechanism” was not something economists seemed to talk about with some exceptions like J. J. Heckman and Robb (1985) who clearly did, even if under different terms (i.e., “selection"). And the idea that the treatment assignment mechanism had to actually represent the real world itself cannot be taken seriously if the very concept of it was not clearly explained.
Angrist was not using instrumental variables estimators to identify causal effects so much as he was grabbing hold of the real-world randomization with instrumental variables. He was throwing a rope around a wild stallion, which is only possible if there is actually a stallion there in the first place. Otherwise the rope lands on the ground and you’re left with nothing.
When Angrist arrived at Harvard as an assistant professor in the economics department, two things happened. First, Ashenfelter’s former student Jim Heckman, himself arguably one of the most important econometricians of the 20th and 21st centuries, a graduate from Princeton, a Nobel Laureate, and a deeply empirically oriented labor economist himself, published a paper challenging instrumental variables’ theoretical ability to estimate anything, most of the time, that had a causal interpretation. The conditions, he showed theoretically, under which it could estimate the average effect of a program for a sample of people were so outlandish as to be unlikely and therefore to be viewed with skepticism. And thus IV was hanging by a thread because of J. Heckman (1990).
The second thing that happened coincidental to Angrist’s arrival at Harvard was that Guido Imbens, a freshly minted econometrician from Brown University, got a job there too. Interestingly, Imbens only barely got that job. He did not interview for it at the annual meetings where economists gather for their interviews, but rather received a phone call from the late Gary Chamberlain afterwards offering him the job to teach probability and statistics as it was a position that had gone unfilled. Imbens had all the makings of being simultaneously a very curious person with a glass-half-full disposition who spent a lot of time with his colleague Josh Angrist, in deep conversation about that dissertation. They both were very familiar with Heckman’s study, and yet Imbens, as he has shared with me, was also very intrigued by what he called the “credibility” of Angrist’s dissertation.
How could it be, after all, that the American government was randomizing people into the military through its draft lottery system and Angrist (1990), using the highest quality data possible, was finding nothing real? It was a strange paradox. On the one hand, J. Heckman (1990), and on the other hand, Angrist (1990): how could they both be right? So, Imbens with Angrist began a very productive collaboration lasting a decade on the econometric properties of instrumental variables once you allow for participants to have different responses to the instrument, as well as different responses to the treatment altogether. This led to the reformulation of instrumental variables as an estimator of the local average treatment effect and ultimately the Nobel Prize in economics—an award they shared with Angrist’s former advisor, David Card from Princeton. This rebooting of instrumental variables in Imbens and Angrist (1994), and again with Don Rubin in Angrist, Imbens, and Rubin (1996), was advantageous for many reasons. It was both the sequel to J. Heckman (1990), as well as to a vast body of work in statistics from Neyman (1923) to Fisher (1925)—and a sequel to the potential outcomes worldview that Rubin had been building out for years. But, maybe just as importantly, this reformulation of IV had nothing whatsoever to do with economics. It was scientifically neutral, making it available for all the sciences, not just economics. One can only speculate as to the value that this reboot of IV had, devoid of all the economic theory that had traditionally saturated IV, for those outside of economics, but it’s hard to imagine it didn’t at minimum build a bridge between the world of econometrics and everyone else.
Angrist’s draft lottery instrument was ingenious because of its clarity and clear rooting in randomization. He was not invoking via hand waving some vague reference to exogeneity, and he wasn’t loading up Stata or R with a bunch of variables as instruments that happened to be laying around. Angrist used his own knowledge about a real world randomizing event that was placing people into the military or not. This was not a study that would be using a model to estimate causal effects, so much as it was using randomization to estimate causal effects—a point so subtle at first that maybe it is easy to miss, but which I try to stress repeatedly throughout this book. It is not the models that estimate the causal effects, nor is it one’s coding acumen. It is not even one’s cleverness. It is rather the treatment assignment mechanism which does, and barring that, a willingness to make assumptions with eyes wide open about the missing counterfactuals and, only then, let the model do that work for us.
2.6 Dropping In from the Rope Swing
Rivers are my favorite bodies of water. I love that they are always moving, I love floating on them lazily, and I love riding them in fierce white water. I love diving into them, swimming in them before dinner. I have told my family that my hope is that when I die, my ashes are sprinkled on the Medina River. Everything about rivers is romantic to me. And so if I chose rivers as my metaphor for this book, then I guess that means I must find all of this material romantic too.
What we are going to do in the pages that follow is climb to the highest part of the hill that we can find, grab hold of a rope, take a running jump and swing down into the middle of this river. There really is no other way than to just dive into it. So the book will constantly be doing whatever I can to help you simultaneously get into the technical details about the statistical methods and econometric tools that I’ve curated for us to learn together. But I am also extremely aware that it’s practitioners who are the primary audience for this book, and so I am constantly trying to do whatever I can to guide you to places where the material in this book can be practiced competently, and not just understood abstractly. So the book mixes my opinions in with technical exposition, as well as includes code for implementing this material with data. The code is sometimes shown and sometimes not, but you will be able to access all of the code online because a free version of this book is available there.
Where there are mistakes, and there most certainly are, they are my fault and not the people and papers I’m reviewing. I will maintain an erratum online documenting these errors before fixing them at the online version. The book is eclectic but I hope that you enjoy it. Let’s dive in now together.
Rilke said you should quit writing poetry when you can imagine yourself living without it (Rilke 2012). I could imagine living without poetry, so I took his advice and quit. Interestingly, when I later found economics, I went back to Rilke and asked myself if I could live without it. This time, I decided I couldn’t, or wouldn’t—I wasn’t sure which. So I stuck with it and got a PhD.↩︎